Experimentation helps you test changes to your product. You can test hypotheses about which changes will lead to optimal results. You may have also heard it called A/B testing, or split testing. Examples:
- You want to test which copy or visual design has the highest conversion.
- You want to test which flow leads to the highest number of purchases.
- You want to test if certain deals & promotions do better with users in a specific country.
- You want to test if showing your website copy in German does better than English in Austria.
- You want to test if certain copy does better within a cohort of new users.
Creating an experiment
Creating an experiment starts with a hypothesis you want to test. Let's use an example of whether a visual update to the sign up button will increase clicks for that button.
After clicking on "new experiment" in the Experiments page, we should see a form like this:
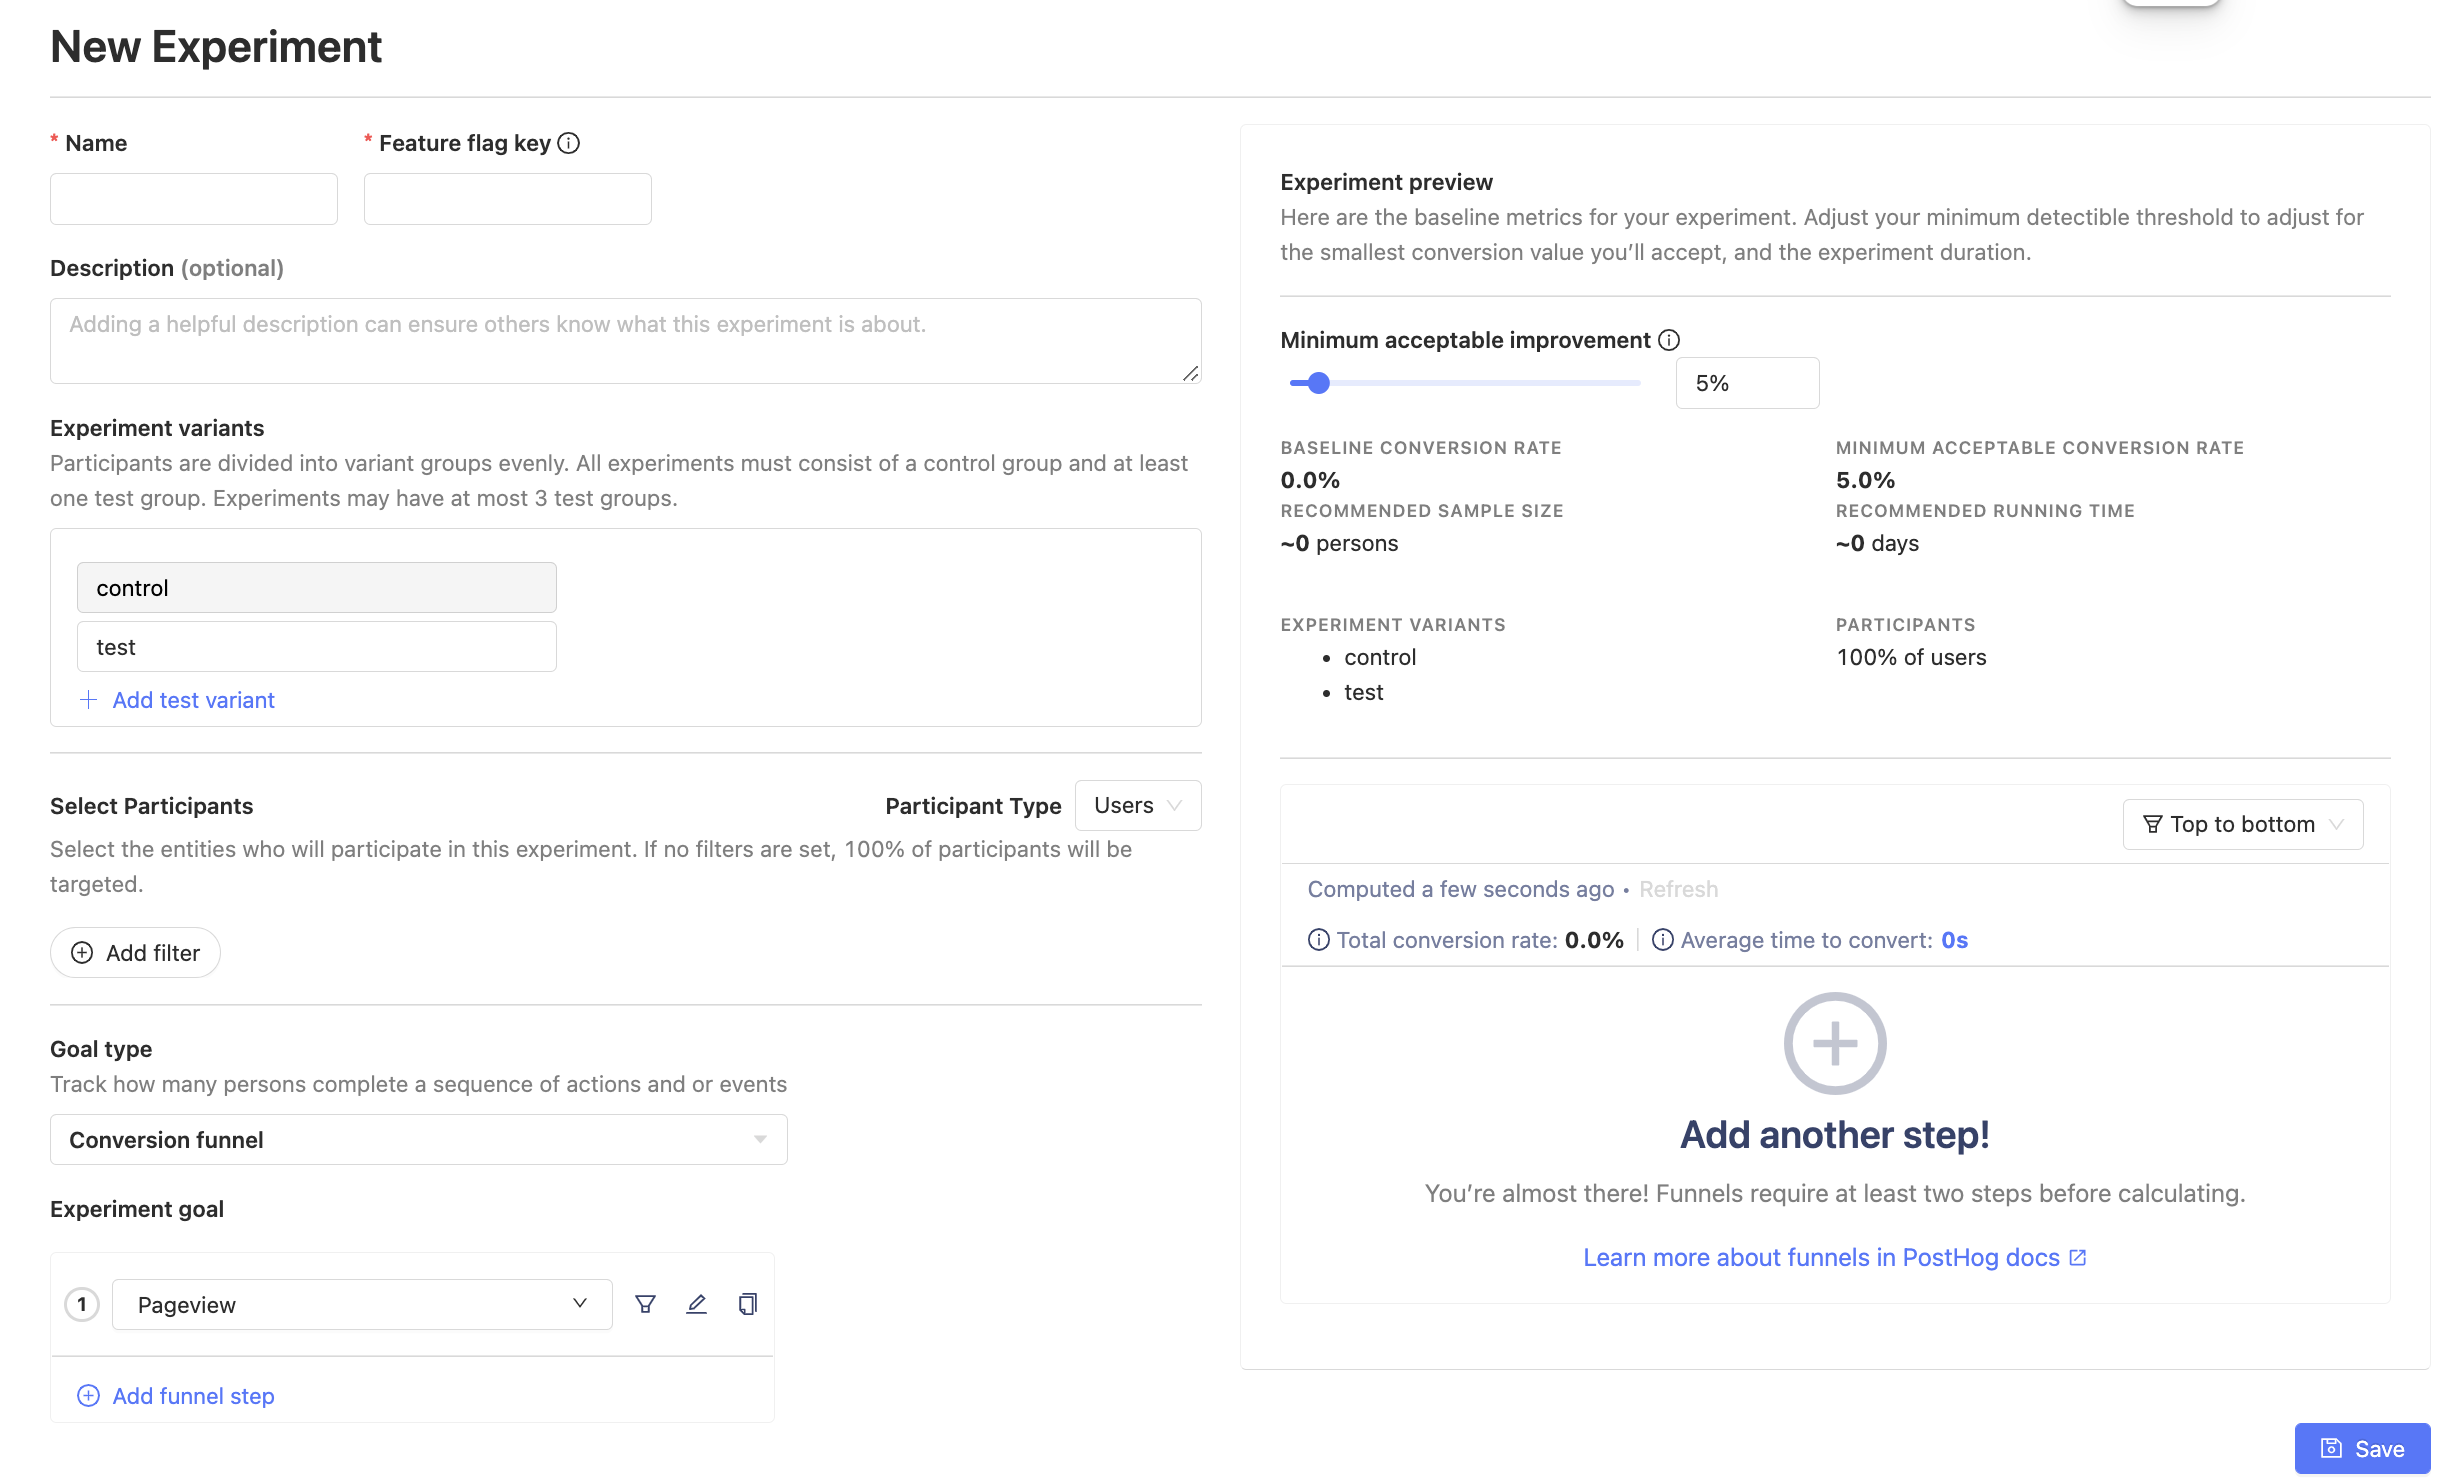
1. Experiment name, feature flag, and testing variants
Let's start in the upper left corner by filling out a name, description, and feature flag for our experiment. Fill in a name for your feature flag - it will be created here by default, linked to the experiment rather than existing as its own entity.
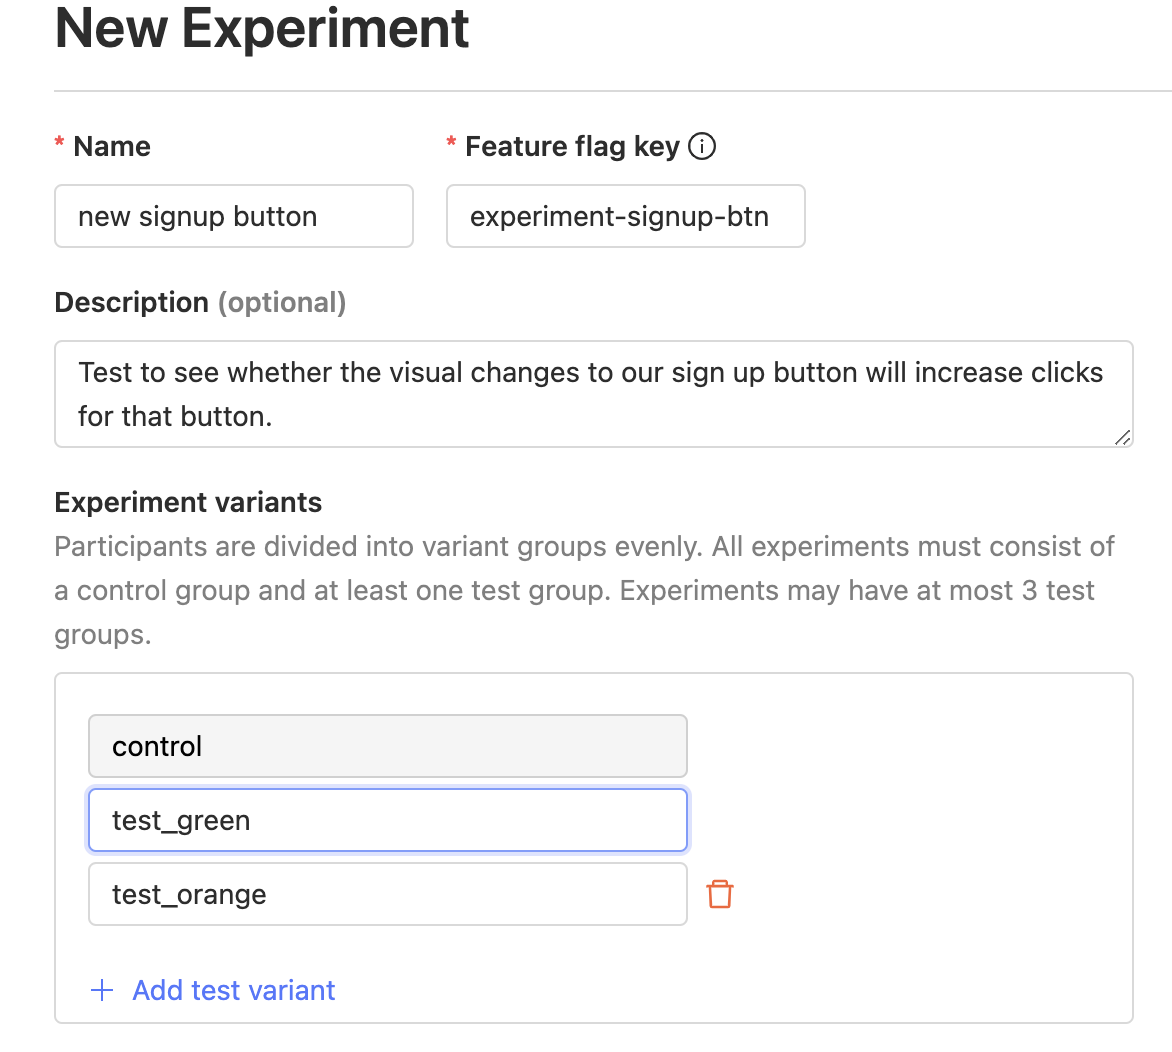
We can also include multivariants for our testing changes. For example, instead of running our experiment with just "control" and "test", we can test for the green visual button change or the orange one or our original control.
2. Participant selection and experiment goal/metric
Next, we want to select our experiment's universe. Here, we've decided that for our sign up button experiment we want to test our hypothesis on users from Asia.
We also want to set our experiment's "goal" now for which metric we want to track. Since we're testing whether the number of sign up button clicks increase or not, we'll use the "Trend" goal to measure aggregate values
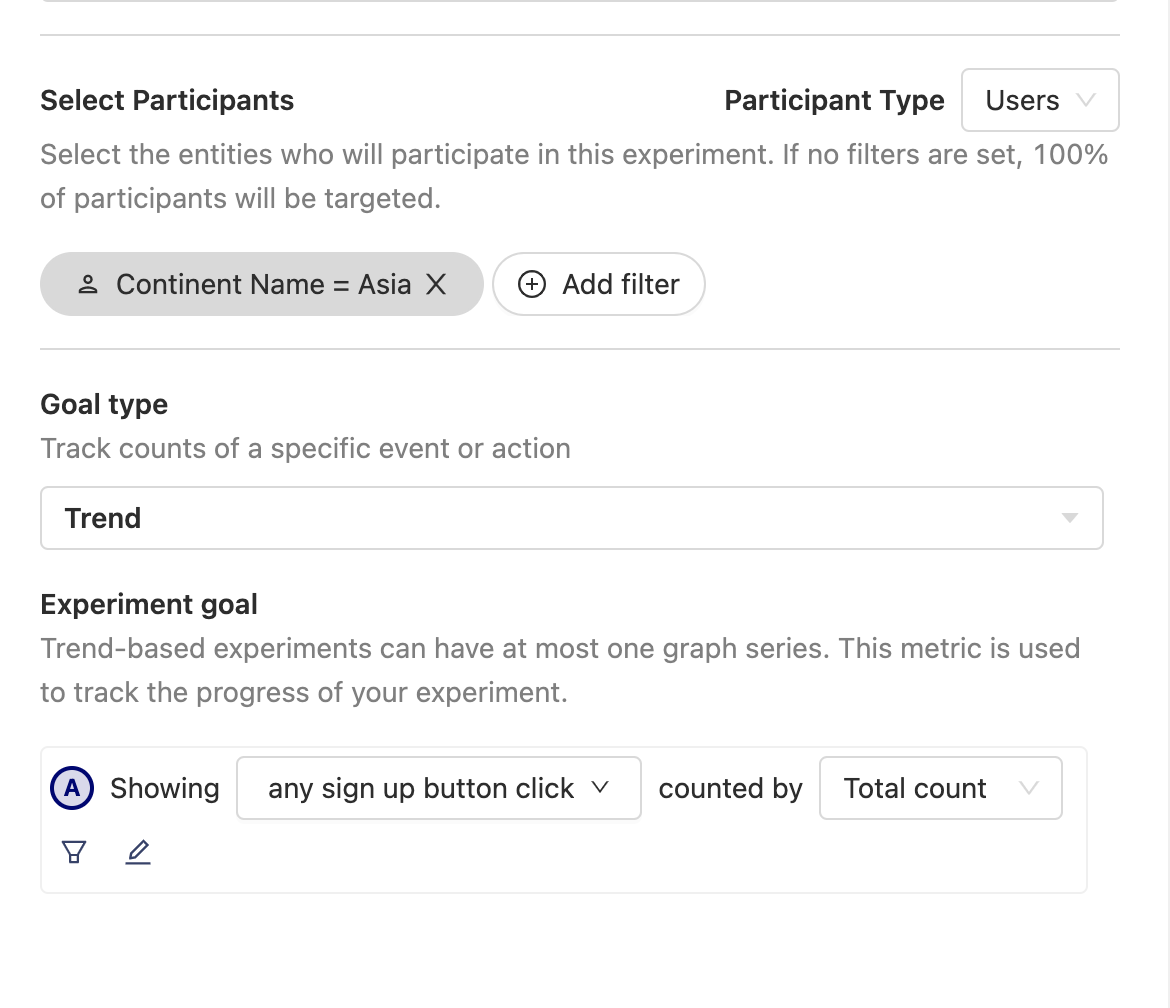
If we want to test a hypothesis for a conversion rate metric, we'll use the "Funnel" goal instead.
3. Experiment preview and minimal acceptable improvement threshold
Finally, in our experiment creation form, look to the upper right corner for our experiment's preview! We can see recommendations for run times and other experiment factors.
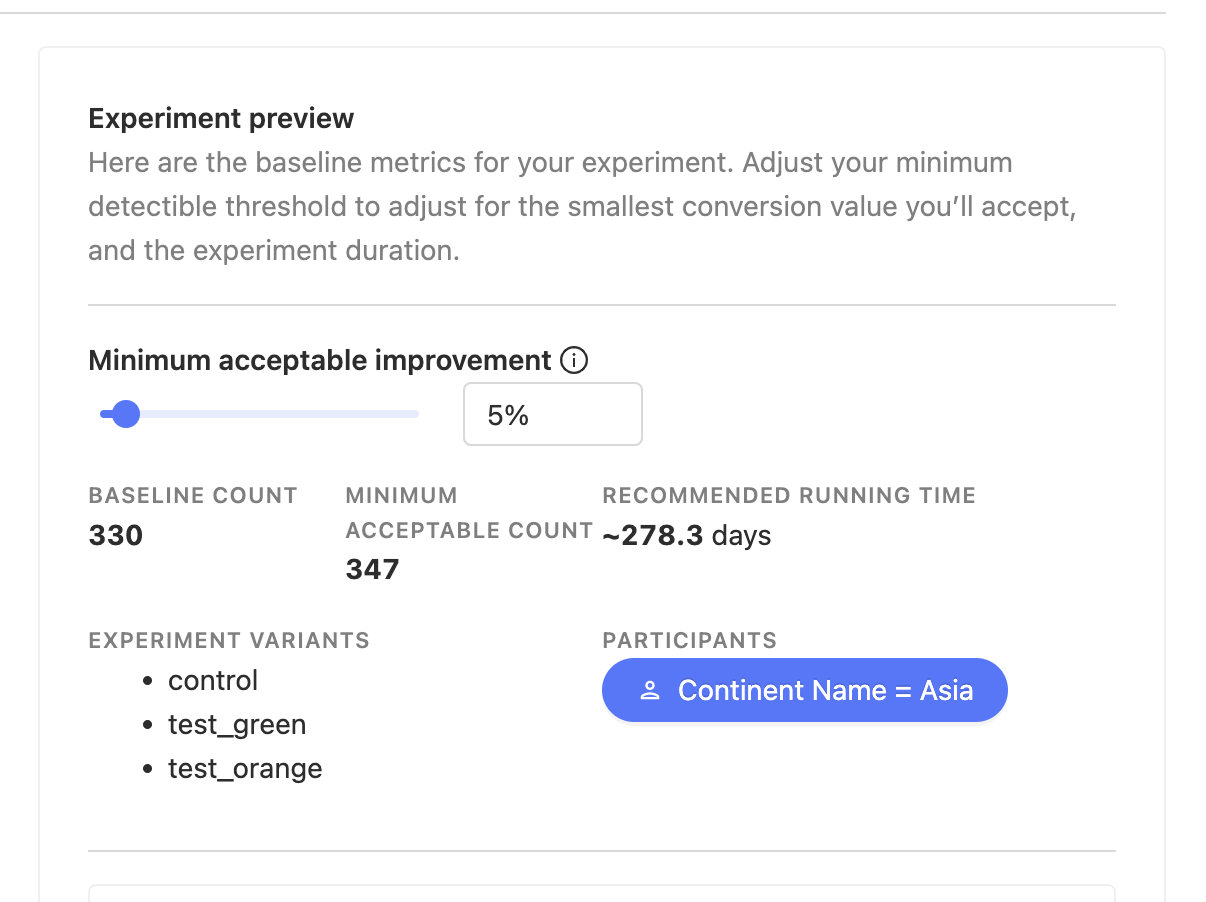
We can also increase or decrease our minimal acceptable improvement depending on how much we care for our test's significance relevant to our other experiment factors.
Perhaps we don't want to wait 278 days for our experiment to run and we'd prefer less precise results in favor of a shorter run time. We can simply bump the threshold to a higher percentage.

Whenever we're ready, hit save on the bottom right corner of the form to create an experiment. Creating an experiment saves it into a draft mode so we'll still have flexibility on making adjustments to it until we're ready to launch it!
Running an experiment
Before you can launch an experiment, you need to implement the code for each feature flag variant. On the draft experiment screen, you'll see a snippet telling you how to query for the variant. It looks something like:
One important gotcha to keep in mind is that feature flag values are loaded asynchronously, so you should use the onFeatureFlag directive to check when feature flags are loaded. That is, call the snippet above inside the onFeatureFlag callback.
Once you've written your code, it's a good idea to test that each variant behaves as you'd expect. If you find out your implementation had a bug after you've launched the experiment, you lose days of effort as the experiment results can no longer be trusted.
To test your experiment, use the web developer console. The experiment draft screen has a snippet for testing your code. Once you've pushed your experiment code, open the console on your browser, and paste the snippet in. This will override the feature flag for you, and you should be able to see the changes you've made on screen.
Once you're satisfied, you're ready to launch your experiment.
Note: The feature flag is activated only when you launch the experiment.
Note: While the toolbar allows you to toggle feature flags on and off, this only works for active feature flags. Thus, it's not always possible to use the toolbar to test experiment feature flag changes.
While the experiment is running, you can see results on the page. Sometimes, in the beginning of an experiment, results can be skewed to one side. For example, if you launched at midnight then people on the other side of the world are active first, and the first few hours of data you collect is all from them. This can artificially skew results to one variant. While possible, it's important that you don't end your experiments at this stage: the results are probably insignificant. This is known as the peeking problem.
While peeking at the results in itself is not a problem, making quick decisions based on preliminary results is problematic. For this reason, we display a banner that informs you whether it's safe to end an experiment or not.
Note that this recommendation doesn't cover all edge cases. It is still possible, when new data comes in, that results flip completely. This is true for any experiments and any significance test in existence today. But, the probability of this happening is very low, which is why most people are comfortable taking this risk. For a 0 risk experiment, you'd have to run it for an infinite amount of time: every new person is new data to be accommodated.
Terminating an experiment
You decide when to terminate an experiment. A banner in your experiment results page will let you know if it's safe to do so, regardless of the original estimated running time. Terminating before significance implies conclusions could be completely wrong. (see Advanced section below to understand how we compute significance)
Once you have decided to terminate an experiment there are a few things to do:
- Click on "Terminate the experiment" on the experiment page. This will ensure final results are kept.
- We recommend you roll-out the winning variant to all your users.
- Share results with relevant members of your team.
- After the winning variant is rolled-out, it's good practice to remove the other variants from your code, and make the winning variant part of your core code (i.e. stop checking for the respective feature flag).
- Document conclusions and findings in your PostHog experiment. This will help preserve context for team members who in the future need to understand what happened.
- Archive the experiment. This will disable the feature flag and ensure your code no longer depends on the flag.
How does it work?
With Experimentation, you start with a hypothesis on how to improve your product (e.g. changing the flow, changing copy, changing visual styles, etc.) and a goal (e.g. improve conversion, improve sign ups, etc.). Once you have those you can:
Create an Experiment which will have a control group and some test variants (at least one, at most three).
Select which users will participate in the Experiment (e.g. paid users, users in a given country, a cohort, or all users).
Based on your user selection and your goal, we will estimate the number of users exposed and the number of days required for your experiment to reach significant results.
We distribute all selected users equally between the control and test groups. So, for example, if there are 3 test variants and 1 control variant, each variant gets 25% of the total users selected.
You can tweak settings on the creation screen to speed up the experiment or adjust user exposure (e.g. you may not want certain users exposed to your experiment).
The actual experiment and what your user sees is controlled in your own code (see below on Creating an experiment). Your code asks PostHog which group does this user belong to and then accordingly show any relevant changes in your app or website. Because this is done in your code you can test any number of things, from changing copy in a button, to taking the user to a different page, or showing them a completely different experience.
Once your experiment is running, we'll automatically let you know which variant leads to the best results. While the experiment is running, we'll also tell you the probability that any given variant is the winning variant.
To ensure your experiment does not introduce any regressions, you can also track secondary metrics. This is particularly useful if you're optimizing a metric that has a natural trade-off with another metric (e.g. you can maximize conversion by reducing your price but then your total revenue may be reduced).
Once your experiment is terminated, you can easily archive and share your results with other team members.
How do we handle statistical significance?
For your results and conclusions to be valid, any experiment must have a significant exposure. For instance, if you test a product change and only one user sees the change, you can't extrapolate from that single user that the change will be beneficial/detrimental for your entire user base. This is true for any experiment that is a simple randomized controlled experiment (e.g. this is also done when testing new drugs or vaccines).
Furthermore, even a large sample size (e.g. approx. 10,000 participants) can result in ambiguous results. If, for example, the difference in conversion rate between the variants is less than 1%, it's hard to say whether one variant is truly better than the other. To be significant, there must be enough difference between the conversion rates, given the exposure size.
PostHog computes this significance for you automatically - we will let you know if your experiment has reached significant results or not. Once your experiment reaches significant results, it's safe to use those results to reach a conclusion and terminate the experiment. You can read more about how we do this in our 'Advanced' section below.
Experimentation vs. Feature Flags
Experimentation and Feature Flags are different features because they serve different purposes. Experimentation is used to test changes to your product where you want to maximize a specific metric (eg. testing a new flow to maximize conversion rate). Feature Flags are used for phased roll-outs (e.g. a new experimental feature you want to make sure works correctly) or as a way to control feature access. Read our Feature Flags user guide for more information on this.
Experimentation uses multivariate Feature Flags under the hood to handle user allocation to an experiment. You'll notice this when checking if a user is assigned to an experiment.
While Feature Flags can be boolean or multivariate, Experimentation always uses a multivariate approach.
Further reading
Want to know more about what's possible with Experiments in PostHog? Try these tutorials: