🌇 Sunsetting Kubernetes Deployments
This page covers our PostHog Kubernetes deployment, which we are currently in the process of sunsetting. Existing customers will receive support until May 31, 2023 and we will continue to provide security updates for the next year.
For existing customers
We highly recommend migrating to PostHog Cloud (US or EU). Take a look at this guide for more information on the migration process.Looking to continue self-hosting?
We still maintain our Open-source Docker Compose deployment. Instructions for deploying can be found here.
This guide covers how to configure monitoring of your self-hosted deployment through Grafana. If you are targeting a production use-case, we highly recommend setting up all of these options.
Getting started
By default, the PostHog Helm chart does not come with Grafana enabled, so we will need to update our config values in order to install it.
Note: This guide requires you to be running a Helm chart version of at least
26.0.6. If you are running an older version, take a look at our guide on how to upgrade PostHog
Setting up cluster monitoring
This section covers setting up basic monitoring for the entire Kubernetes cluster, and provides basic metrics such as CPU usage, memory usage, and disk IOs.
To set up basic monitoring, we will need to enable the following two charts:
which can be done by adding the following lines to our values.yaml
Next, we'll need to upgrade our deployment to spin-up the additional services, which can be done using the following command:
Connecting to Grafana
Once our deployment is back up and running, we can now log in to Grafana to see our dashboards.
By default, a single user is created with the username admin and an auto-generated password can be fetched by running:
Next, we'll connect to Grafana by port-forwarding into the posthog-grafana service:
Our Grafana dashboard should now be available at localhost:8080, and we can log in using the username admin along with the password we just retrieved.
For information on exposing Grafana through an Nginx ingress, take a look at the configuration options for the upstream Grafana chart.
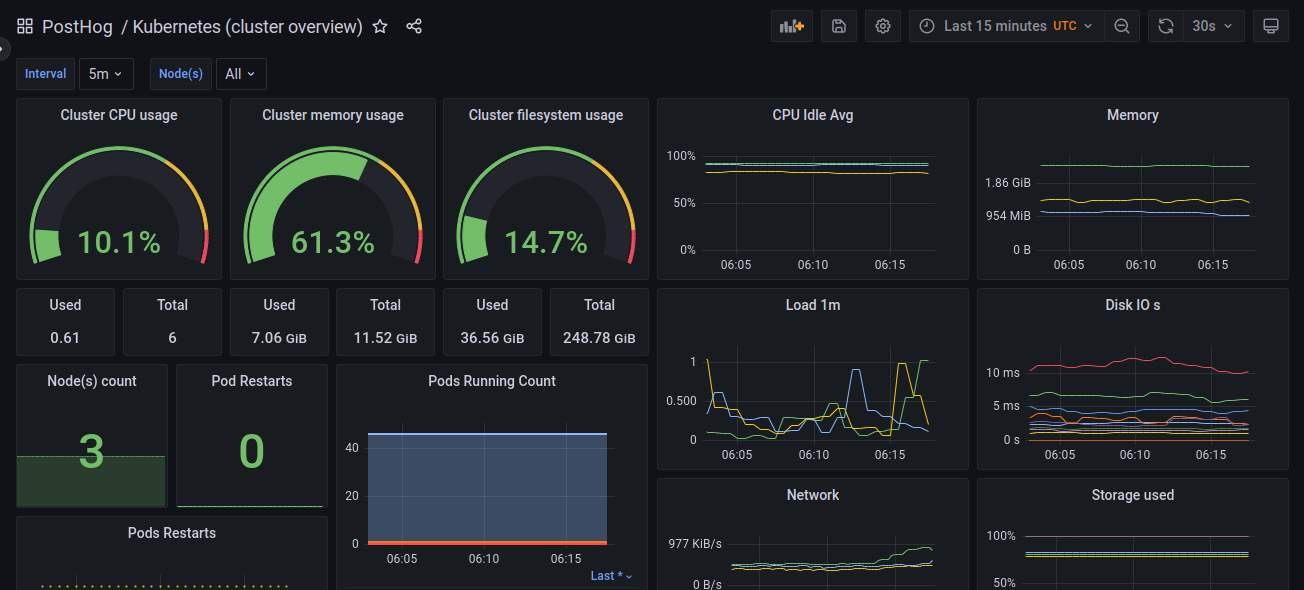
Finally, if we now go to the list of Dashboards and navigate to PostHog > Kubernetes (cluster overview), you should see a pre-configured dashboard with a number of metrics related to our cluster!
For more information on configuring and using Grafana, check out the official docs
Setting up service-specific monitoring
While the basic cluster-overview monitoring is useful for monitoring overall cluster health, there is still a lot of important information about each service within PostHog that isn't available. To fix this, PostHog includes a number of exporters for Prometheus that allow us to stream metrics from specific services into their own separate dashboard.
For more information on the configuration values for each service, check out ALL_VALUES.md for the full list of configuration options.
Kafka monitoring
For streaming information from Kafka, we use the prometheus-community/prometheus-kafka-exporter chart, which can be installed by setting prometheus-kafka-exporter.enabled to true in your values.yaml file.
If you are using an external Kafka service, you can use the prometheus-kafka-exporter.kafkaServer option to set the location for your managed service.
PostgreSQL monitoring
To expose PostgreSQL metrics, we use the prometheus-community/prometheus-postgres-exporter chart, which can be installed by setting prometheus-postgres-exporter.enabled to true in your values.yaml file.
If you are using an external PostgreSQL deployment, you can use the prometheus-postgres-exporter.config.datasource option to set the location for your managed service.
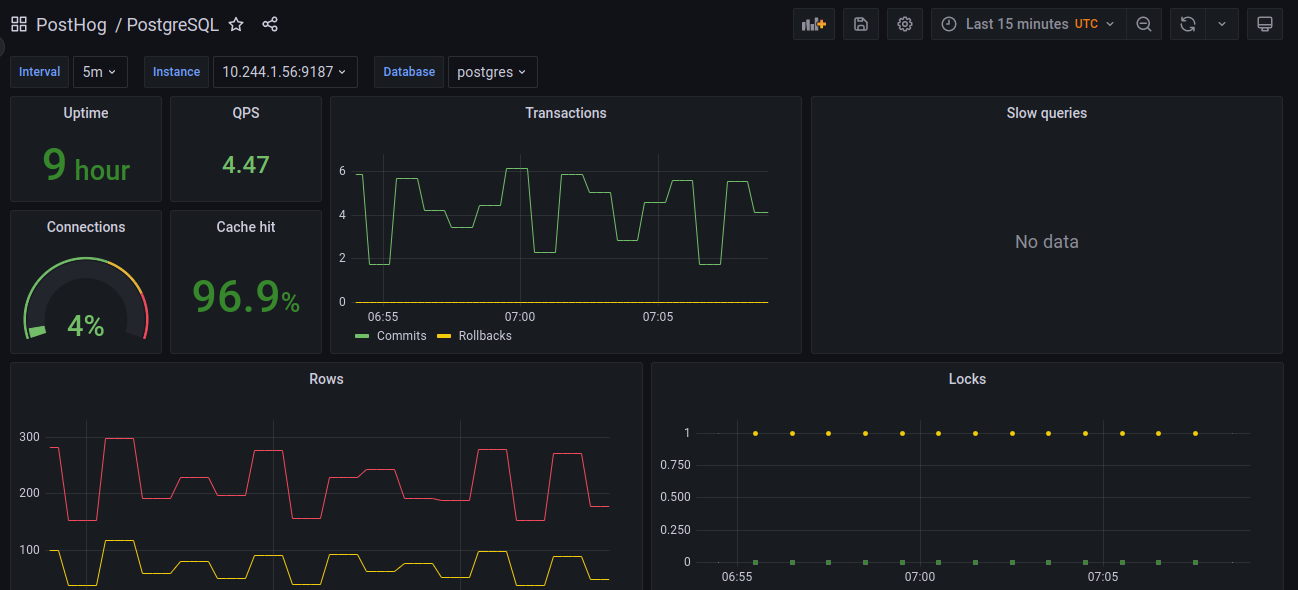
A sample of the default Postgres dashboard
Redis monitoring
To expose metrics from Redis, we use the prometheus-community/prometheus-redis-exporter chart, which can be installed by setting prometheus-redis-exporter.enabled to true in your values.yaml file.
If you are using an external Redis service, you can use the prometheus-redis-exporter.redisAddress option to set the location for your managed service.
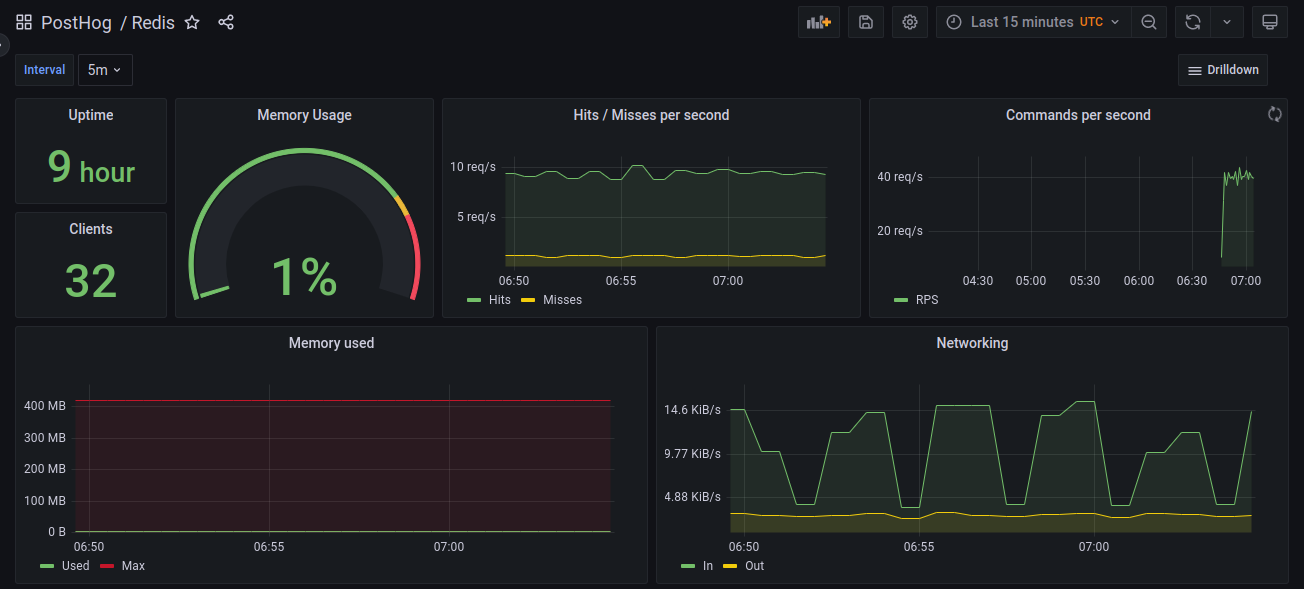
A sample of the default Redis dashboard
Configure log-aggregation with Loki
This section covers setting up aggregation for logs using Loki, which allows you to query and explore logs from all of your services. This step requires that you already have Grafana set-up, which you can do by following the instructions in the basic cluster monitoring section.
To set this up, we will need to enable the following two charts:
which can be done by adding the following values to your configuration:
Once again, we will need to upgrade our deployment for the new changes go into effect, which can be done by following command:
After our deployment is finished, we can log back in to Grafana, and navigate to the 'Explore' tab to start viewing our logs.
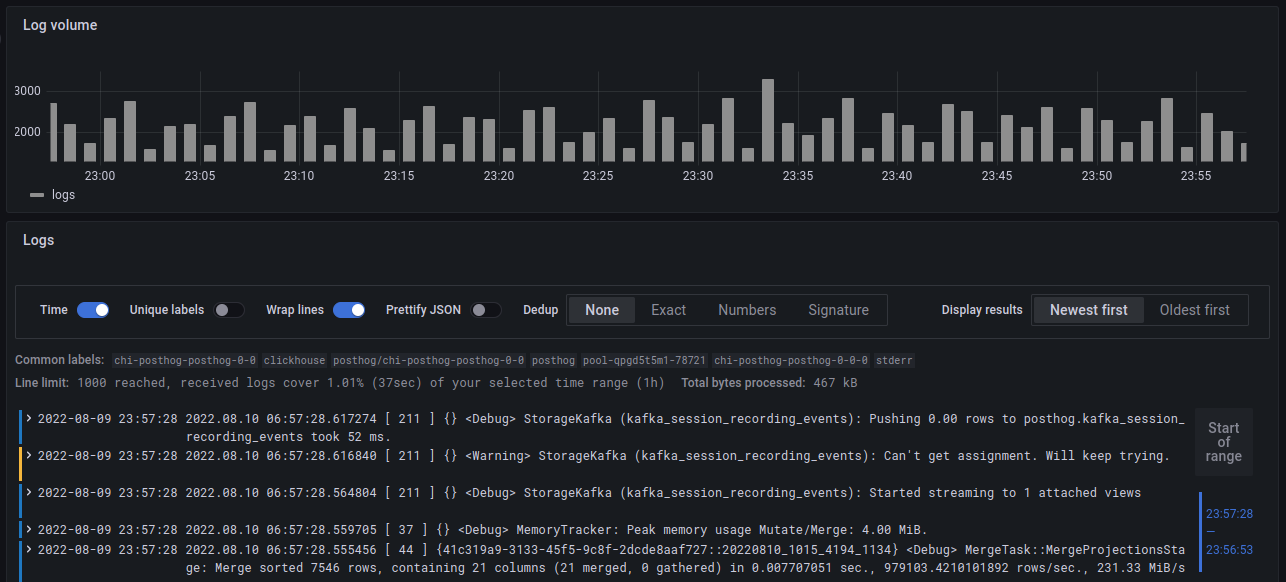
Let's try viewing the logs for Clickhouse.
To start, we'll switch our datasource in the top bar from 'Prometheus' to 'Loki', which will open up the Query Builder.
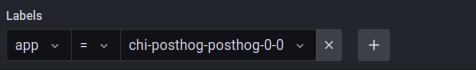
We can create a query for this by setting the app label to equal chi-posthog-posthog-0-0, which will show us only the logs which are labeled as part of the Clickhouse app.
Running this query, we'll see we get back a graph showing our log-volume over time, as well as a list of the log lines that matched our query!
For more information on how to configure Loki and how to write more advanced queries, we'd recommend you checkout the Loki docs.